Grafana
Grafana is a powerful open-source analytics and monitoring tool that allows you to visualize data in a highly customizable way. This guide will walk you through the steps to install Grafana from the APT repository on a Debian system.
Prerequisites
Before you start, make sure your system is up-to-date. Run the following commands to update your package list and upgrade all installed packages
1
2
sudo apt-get update
sudo apt-get upgrade -y
Additionally, ensure that you have sudo privileges to execute administrative commands.
Step 1: Install Prerequisite Packages
Grafana requires some prerequisite packages. Install them by running the following command:
1
sudo apt-get install -y apt-transport-https software-properties-common wget
- apt-transport-https: Allows APT to communicate over HTTPS, which is required for secure access to external repositories.
- software-properties-common: Provides a utility for managing software repositories.
- wget: A utility to download files from the web.
Step 2: Import the Grafana GPG Key
To ensure the integrity of the packages you are about to install, you need to import the Grafana GPG key. This key is used to verify the authenticity of the packages. Run the following commands:
1
2
sudo mkdir -p /etc/apt/keyrings/
wget -q -O - https://apt.grafana.com/gpg.key | gpg --dearmor | sudo tee /etc/apt/keyrings/grafana.gpg > /dev/null
- mkdir -p /etc/apt/keyrings/: Creates a directory to store GPG keys.
- wget -q -O - https://apt.grafana.com/gpg.key: Downloads the Grafana GPG key.
- gpg –dearmor: Converts the GPG key to a format that APT can use.
- sudo tee /etc/apt/keyrings/grafana.gpg > /dev/null: Saves the key to the appropriate location.
Step 3: Add the Grafana APT Repository
Next, you need to add the Grafana APT repository to your system’s list of package sources. This will allow you to install Grafana directly from the APT repository. You have two options:
Stable Releases
For stable releases of Grafana, run the following command:
1
echo "deb [signed-by=/etc/apt/keyrings/grafana.gpg] https://apt.grafana.com stable main" | sudo tee -a /etc/apt/sources.list.d/grafana.list
Beta Releases
If you want to install beta releases of Grafana, use this command instead:
1
echo "deb [signed-by=/etc/apt/keyrings/grafana.gpg] https://apt.grafana.com beta main" | sudo tee -a /etc/apt/sources.list.d/grafana.list
This will add the chosen repository to your system’s package sources.
Step 4: Update the Package List
After adding the repository, you need to update the list of available packages:
1
sudo apt-get update
This will fetch the latest package information from the newly added Grafana repository.
Step 5: Install Grafana OSS
Finally, to install the latest open-source release of Grafana, run the following command:
1
sudo apt-get install grafana
This will download and install Grafana and its dependencies.
Step 6: Start and Enable Grafana
After the installation is complete, you can start Grafana and enable it to start at boot with the following commands:
1
2
sudo systemctl start grafana-server
sudo systemctl enable grafana-server
- start grafana-server: Starts the Grafana service immediately.
- enable grafana-server: Configures Grafana to start automatically on system boot.
Step 7: Access Grafana
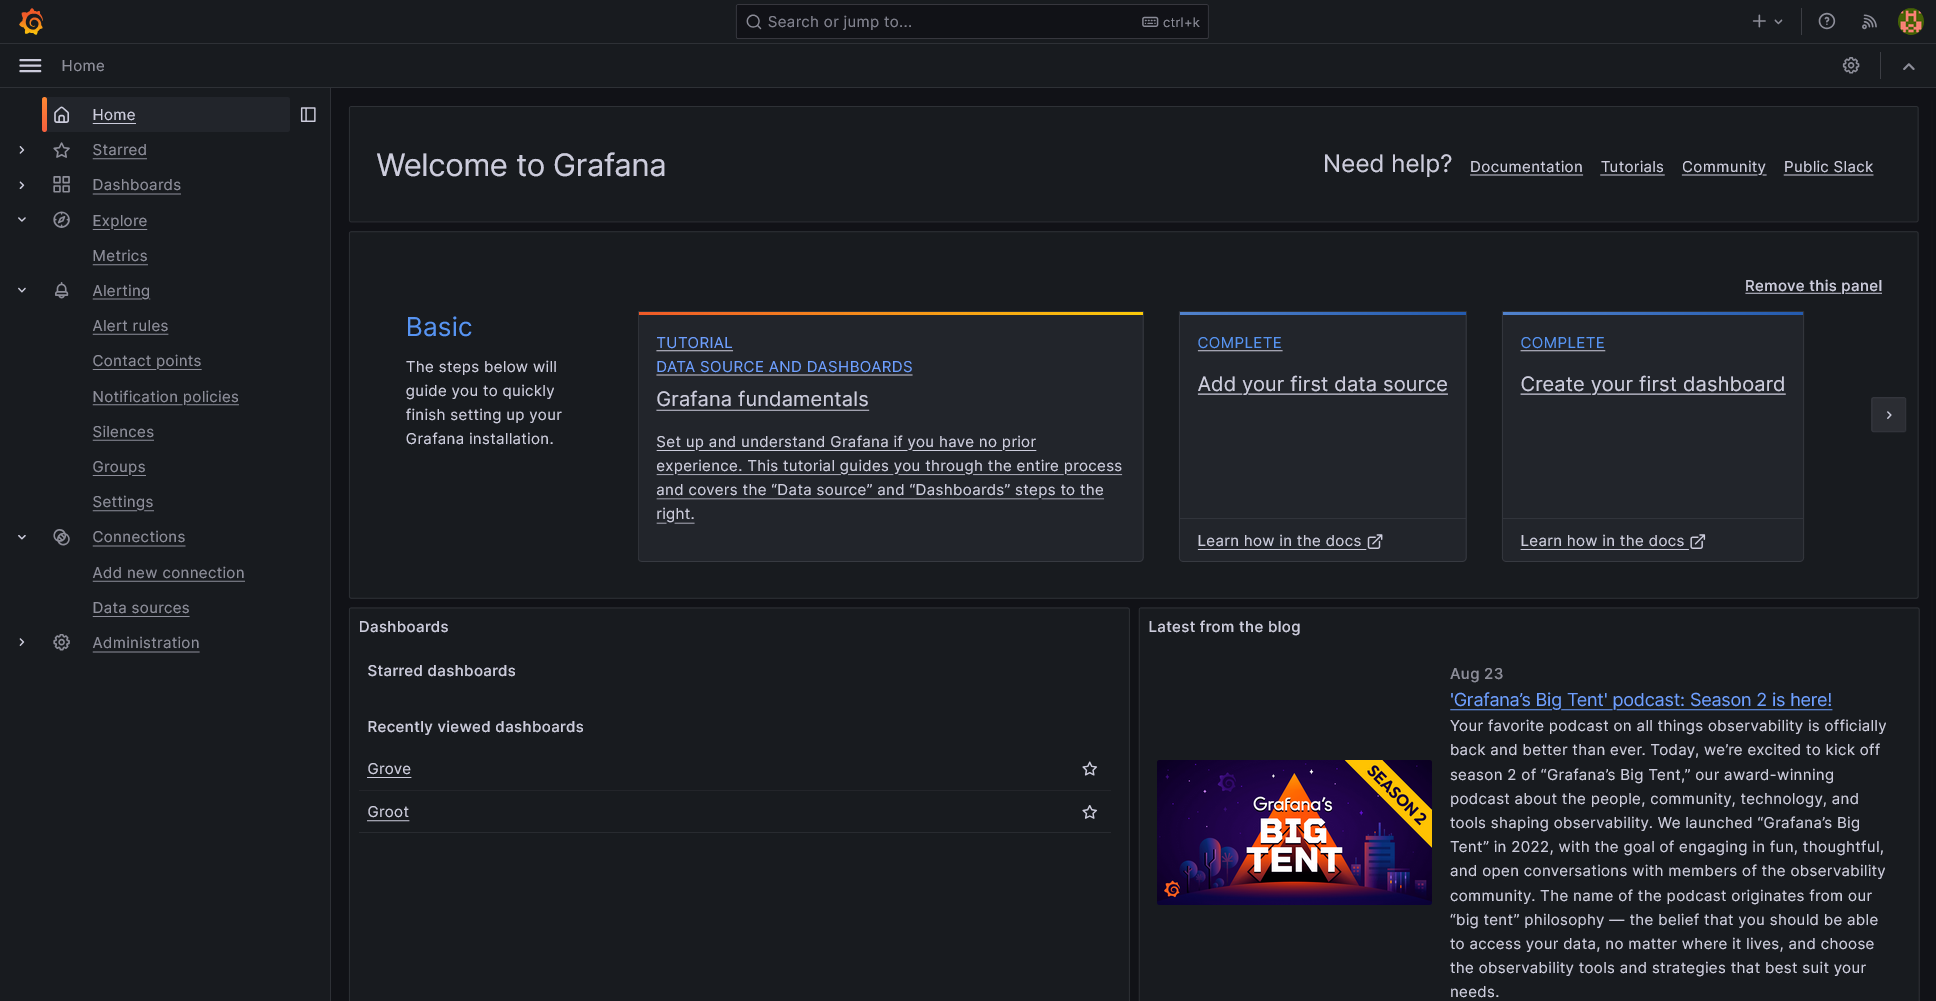
Grafana runs on port 3000 by default. You can access the Grafana web interface by opening your web browser and navigating to:
1
http://your-server-ip:3000
Change the
/etc/grafana/grafana.inifile according to your needs and restart the grafana service
Replace your-server-ip with your server’s actual IP address. Default Login Credentials
The default username and password for Grafana are:
- Username: admin
- Password: admin
Upon the first login, you will be prompted to change the password. Once you logged in add the data source and start configuring grafana to monitor and visualize your data.
For more detailed documentation and advanced configuration options, visit the official Grafana documentation


